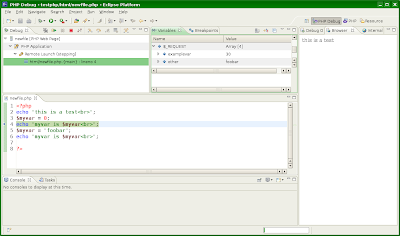
I finally had a working version of PDT (Php eclipse plugin) and XDebug, so that I can finally debug, not only php script, but also php web sites! :-)
This blog post helped me a lot, but I must also admit that pdt people did a wonderful job, and now everything seems to work out of the box!
First of all I relied on the pdt all in one version (i.e., eclipse together with all the requested plugins and the pdt plugin), that can be found at http://www.eclipse.org/pdt/downloads.
However, you also need to install xdebug and (k)ubuntu already has a package for this, so you just need to type
apt-get install php5-xdebug
Now just check the path of the xdebug.so library file, in my case it is
/usr/lib/php5/20060613+lfs/xdebug.so
then you'll need to add some parts in the php.ini configuration file, so you need to add at the end of your /etc/php5/apache2/php.ini these lines (use the path of xdebug.so above):
; XDebugAlso, set implicit flush on in the same php.ini file, so you need to search for implicit_flush in the file and make sure it is set to on:
zend_extension="/usr/lib/php5/20060613+lfs/xdebug.so"
xdebug.remote_enable=true
xdebug.remote_host="127.0.0.1" ; if debugging on remote server,
; put client IP here
implicit_flush = On
Now you're set and you can run eclipse, and try to make a new Php project with a simple file, and try to debug it!
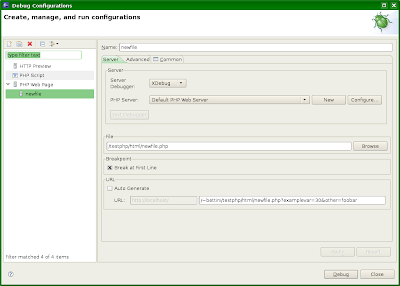
You need to create a new debug configuration, in particular a "Php Web Page" debug configuration. Also make sure that the server debugger is set to XDebug. Then specify the php file you want to test (in this example is newfile.php). Unless the project and all files are already in the root directory of your web server, you need to manually set the URL, so uncheck "Auto Generate" check box and write the complete path (starting from the root of your webserver directory, or, as in my case, a path relative to my user web space); this is also a way of passing, for instance, some GET arguments in the URL, as in this example: xamplevar=30&other=foobar.

Before starting the debugger, make sure you have the web browser set in eclipse; I'm using the internal web browser (actually the only one available in this eclipse installation). NOTE: sometimes, when starting eclipse, the web browser seems to have been lost, and you'll get an error when starting the debugger; in this case I simply restart eclipse.


No comments:
Post a Comment